
New voices 18 June 2020
In order to become carbon neutral by 2050, France has adopted an ambitious roadmap that concerns all sectors of the economy. Of particular importance is passenger transport since the National Low Carbon Strategy (SNBC, for Stratégie nationale bas-carbone) aims to make it almost entirely carbon-free. Aurélien Bigo draws on the historical evolution of carbon emissions to assess the SNBC in light of the various prospective scenarios. He asks whether the government’s scenario can do without slowing down travel to properly address the urgency of the energy transition.
In 2017, France declared its aim to be carbon neutral by 2050 in order to comply with a strategy to contain global warming below 2 degrees Celsius. This target, which is more ambitious than previous ones, is to be achieved with the implementation of the National Low Carbon Strategy (or SNBC, for Stratégie nationale bas-carbone). SNBC plans to lower CO2 emissions by a factor of 5.7 between 2015 and 2050 - that means going from 458 to 80 million tons per year 1. As part of this strategy the transport sector must aim to be almost entirely carbon-free. Land transport in particular, which currently accounts for more than 90% of the sector’s oil consumption, has to end its reliance on fossil fuels. Such a transformation in 30 years presents a huge challenge.
To achieve this goal, the SNBC has established five levers
2
* Moderating the demand in transport, which corresponds to the number of kilometers travelled by French people; * Modal shift, i.e. lowering the share of kilometers travelled by individual road modes (cars, motorized two-wheelers, some light commercial vehicles) and by plane (for domestic journeys in France), in favor of the share of kilometers travelled by public transport (buses and coaches), by train and by active modes (walking and cycling); * Increasing the occupancy rate of vehicles, defined as the number of people per vehicle; * Improving the fuel efficiency of vehicles, i.e. reducing the energy consumed for every kilometer travelled (e.g. improving engines or reducing vehicle size); * Decreasing the carbon intensity of energy, i.e. CO2 emissions per unit of energy used, this intensity being high for oil and lower for electricity or renewable energies.
5 levers to decarbonize transport - National Low-Carbon Strategy
What are the levers that the SNBC favors to meet the decarbonization goals and what is the probability that its prospective scenario will be achieved? There are three approaches to providing answers to these questions: first, what has been the evolution of CO2 emissions since the 1960s and what has been the role of public policy in this evolution? Second, how does the SNBC scenario fare when compared to other prospective decarbonization scenarios? Finally, what impact does the evolution of the average speed of travel have and what role could it play in the overall goal to achieve carbon neutrality?
Between 1960 and 2017 CO2 emissions increased by a factor of 4.2, peaking in the early 2000s before slightly decreasing 3. Demand for transport has been the main driver of emissions: the curves tracking CO2 emissions and demand have remained close over the entire period, with the number of kilometers travelled having multiplied by 4.7 since 1960. This increase slowed down in the 2000s, when CO2 emissions fell slightly.
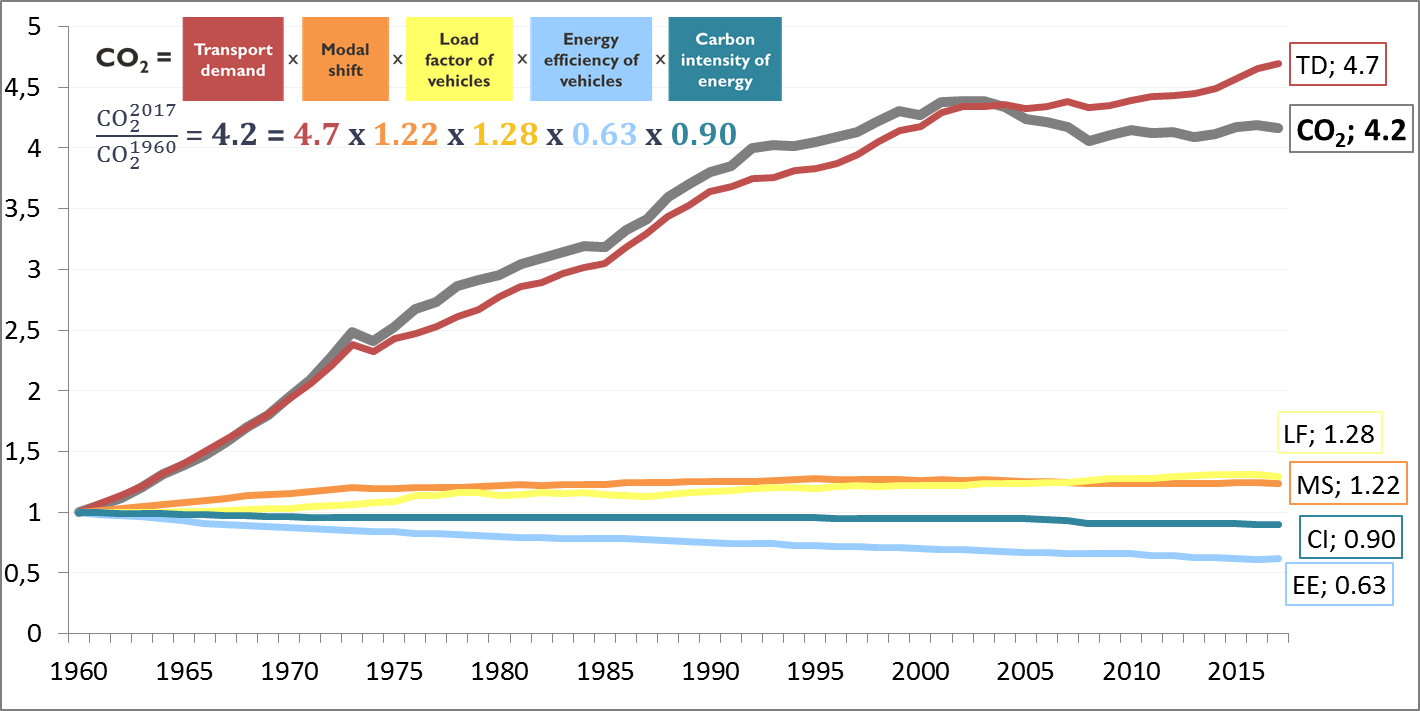
Decomposition of the evolution of CO2 emissions from passenger transport from 1960 to 2017
This very small decoupling between demand and emissions over the period reveals that the other four levers had only a small impact, which can be explained by the fact that they greatly counteracted each other: while over this period there has been progress in energy efficiency (-37% impact on CO2 emissions), along with a small improvement in the carbon intensity of energy (-10% in emissions per unit of energy consumed), this was largely offset by a modal shift that was overwhelmingly towards motorized vehicles at the beginning of the period (22% increase of CO2 emissions) and by a lower occupancy rate in cars (28% increase of CO2 emissions).
While annual passenger transport emissions have decreased since the 2000s, we must question what environmental impact public policies have had on this evolution. These policies have mainly focused on modal shifts towards public transport, vehicle fuel efficiency and developing biofuel.
After a growing popularity of individual cars, since 1995 there has been a modal shift towards public rail transport. As a result of this emissions decreased by 2.7 MTCO2 per year, a relatively small change, equating to 3% of all emissions in the passenger transport sector.
In terms of energy efficiency, no significant break in long term trends was observed in connection to public policies during this period. 4 As for the reduction in emissions due to the development of biofuels (and so the reduction in energy carbon intensity), it is estimated at 5.2 MTCO2 in the decomposition analysis. However, this figure is questionable: the biomass carbon neutrality convention considers that the CO2 emitted by biofuels during their combustion was captured by the plant during its growth. It implicitly (and incorrectly) assumes that no CO2 would have been captured on the surface used if there weren’t any biofuels being cultivated. In fact, when we take into account the life cycle analysis 5 and possible changes in land use (including possible deforestation) related to the production of biofuels consumed in France, their climate impact appears to be similar to oil. Counting the emissions associated with their combustion 6 would therefore be more accurate.
As a result, this would reduce the decoupling of demand and CO2 emissions observed between 1960 and 2017 to only 7% (compared to 12% when biofuel emissions are excluded). It would also reduce the measurable effect of environmental public policies on emissions reduction to just the 3% related to modal shift. Finally, the first explanation for the peak in CO2 emissions is the stabilization of total demand between 2002 and 2009, which equates to a decrease in the number of kilometers travelled per person, offset by population growth. This evolution, sometimes known as peak travel, will be examined below, but it is not the result of environmental public policies, which until today didn’t aim to reduce the number of kilometers travelled. On the contrary, these policies may have increased the number of kilometers travelled through measures indirectly affecting demand (such as increasing public transport options or improving engine fuel efficiency, thus encouraging people to travel more kilometers), by financing transport infrastructure including for polluting modes (building motorways, subsidizing small airports), or by implementing land planning strategies that encourage longer distances (urban sprawl, shopping malls on the outskirts of cities).
The same levers can be used to compare the SNBC with other prospective scenarios for decarbonizing mobilities, in order to assess the potential of each lever and to understand the broad lessons that emerge from these projections.
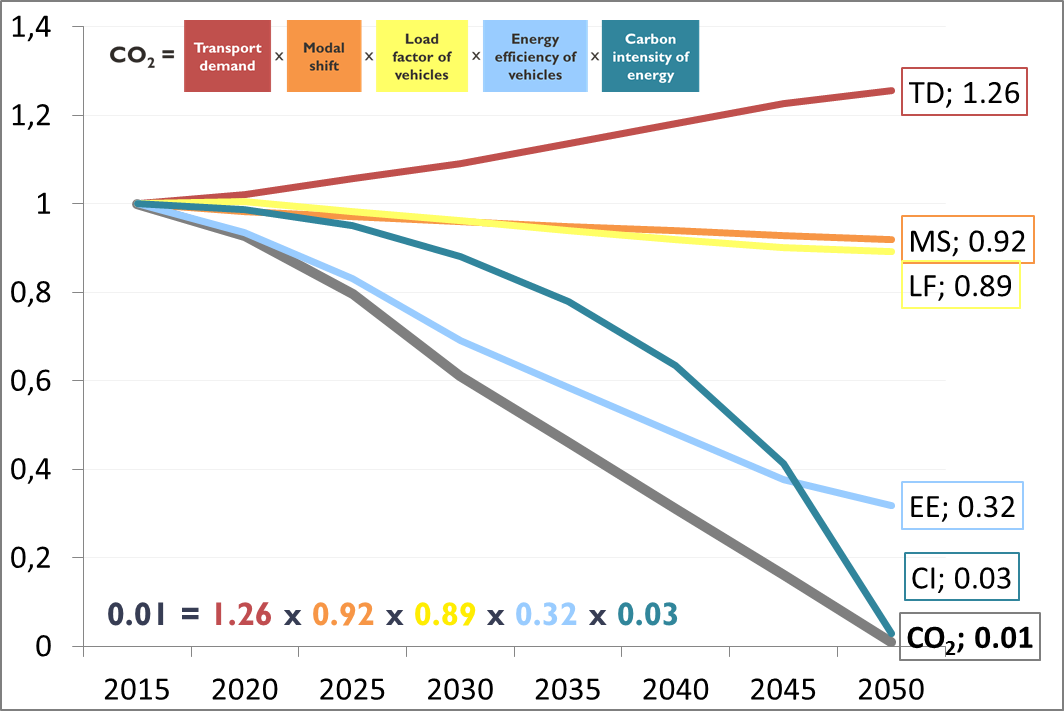
Decomposition of CO2 emissions from passenger transport in the SNBC scenario between 2015 and 2050
The scenario of the French strategy foresees, between 2015 and 2050
7
The main emission reductions in this scenario therefore come mostly from technological factors, in particular the energy efficiency of vehicles in the early years, and the gradual development of electric cars. As such, the stagnation of CO2 emissions from new vehicles between 2015 and 2019, which reflects changes in both energy efficiency and carbon intensity, is worrying and threatens to undermine short-term climate goals. The expected progress in terms of energy efficiency seems all the more difficult to achieve since the SNBC doesn’t provide measures to significantly reduce the weight of vehicles or to limit speeds on the fastest roads, which are two major levers in this area. However, these measures would help not only to reduce the consumption of internal combustion vehicles, but also limit the battery size of electric cars, thus lowering the environmental impact of manufacturing them.
The projected evolutions in the SNBC can be compared to the potentials identified by other French prospective scenarios, which offer contrasting visions of the energy transition of transport. The contribution of the five levers was therefore assessed for 13 French scenarios produced by different actors: 4 baseline scenarios projecting an evolution of current trajectories without additional public policies, and 9 proactive scenarios aiming for a drastic reduction in CO2 emissions by activating the various levers. 9
Without providing the results for each scenario 10, the chart below compares, for the five levers: the expected evolution in the SNBC (blue dots); the average evolution for all four baseline scenarios (upper end of the rectangles, in red); and the average evolution of the four most ambitiously proactive scenarios on each lever (lower end of the rectangles, in green).
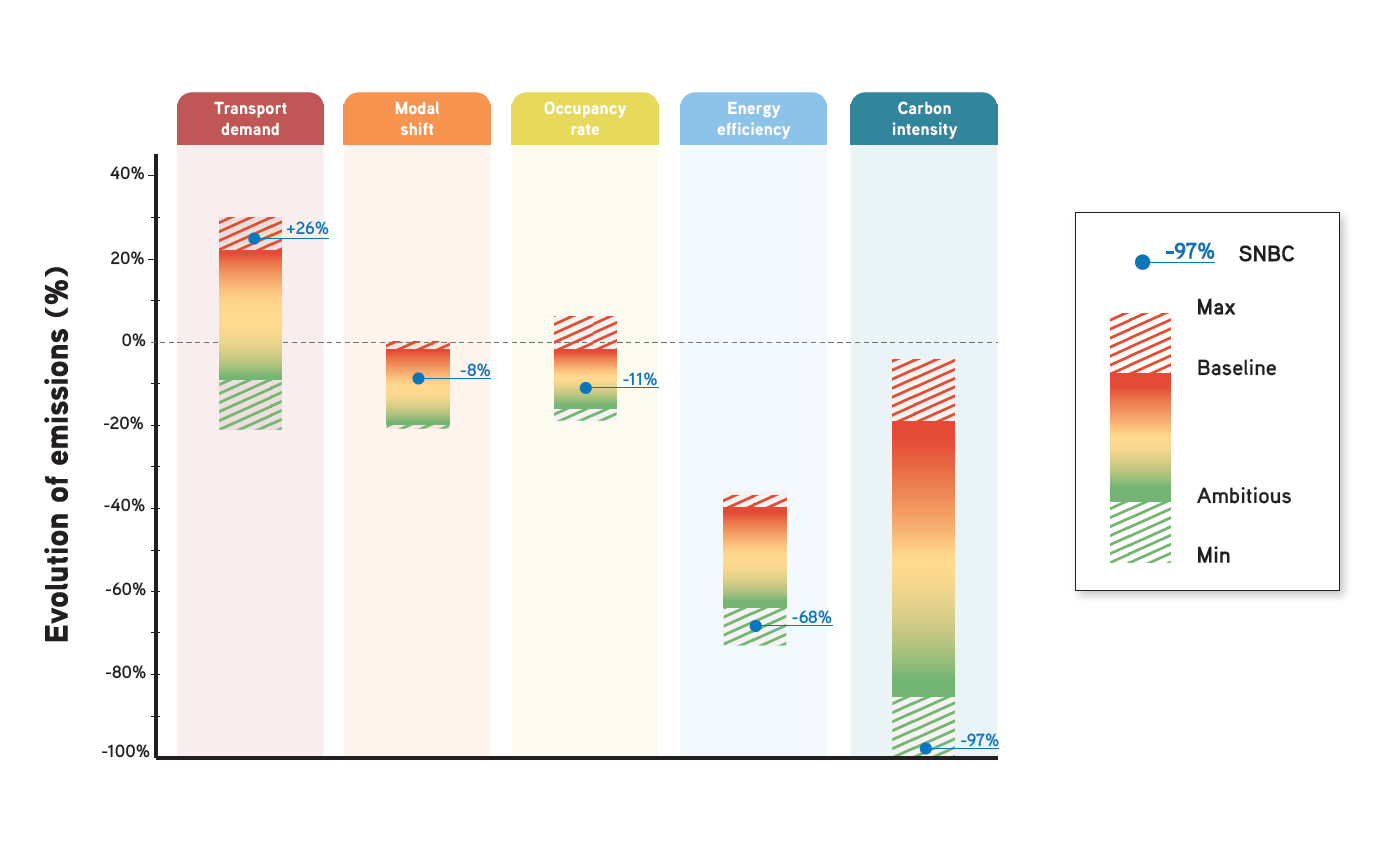
Comparison of the emission reduction potentials of the 5 levers by 2050 in the baseline scenarios, proactive scenarios and the SNBC
The first observation is the SNBC’s moderate to very low ambition on the first three factors of the decomposition, which are mainly levers of land use (such as the location of housing and activities), mobility organization (such as creating carpooling platforms) and incentives for behavioral changes (such as building infrastructure for bicycles). The SNBC forecasts an even stronger increase in demand than the baseline scenarios, which already forecast an average increase of around 20%, while the most ambitious scenarios on this point project on average a decline of almost 10% 11. Less surprisingly, the SNBC is relatively unambitious on modal shifts and carpooling. These are identified by the other scenarios as having the potential to reduce emissions by approximately 20%. Thus, the limited role given to these levers in the pursuit of a global carbon neutrality goal forces the strategy to be even more ambitious than the other proactive scenarios on the levers of energy efficiency and carbon intensity.
In practical terms, the SNBC therefore relies almost exclusively on technology, which it claims will enable it to reach its climate goals both in the short and long term.
Analysis of recent trends shows that if the SNBC scenario is to be realized, there needs to be a sharp increase in the reduction of CO2 emissions per kilometer travelled: while emissions per kilometer travelled have decreased relatively constantly since 1993 by about 0.5% per year (or -0.5 gCO2/km, all modes together, including here biofuels emissions), the SNBC plans to achieve a fivefold annual reduction between 2015 and 2030 (-2.7%/year). But over the first four years of this period, instead of dropping, emissions from new vehicles have tended to stagnate, which is a far less positive outcome than even the baseline scenarios projected. In addition, there have been no observable developments in carpooling or modal shifts that could have a significant impact on emissions.
Recent trends indicate that demand has had the greatest influence on emissions in the short term, being very reactive in particular to fuel price fluctuations. Yet the issue of demand is notably absent from the debates and provisions of the French Mobility Orientation Law (LOM) passed in 2019. Moderating demand will be a major requirement for achieving significant modal shifts: for example, shifts to bicycles for short distances and night trains for long distances will thus represent an even greater share of the total number of kilometers travelled if this total decreases. Decarbonizing energy will also require demand to be moderated, as the technologies that are being developed rely on resources that are in limited supply and whose environmental impacts are sometimes significant 12. Finally, international air transport (excluded from the previous comparison because it isn’t studied by all scenarios) doesn’t really have a modal shift alternative, nor is there any technology available in the short term that would enable compliance with the Paris agreement. Again, only a moderation of demand can reduce CO2 emissions in this sector.
In order to better understand what power public policies have to change demand in terms of mobility, it is necessary to better understand the main determinants of its evolution over time.
What have been the mutations and constants of mobility over the past two centuries? In the 1800s people mainly walked to get around and French people travelled about 4 or 5 kilometers a day, which is 10 times less than today. Since the number of trips per day per person has remained stable (between 3 and 4), this indicates that the average travel distance has increased tenfold. Meanwhile, travel times have remained relatively stable over time in different parts of the world - approximately one hour of travel per day, which is a constant known as the “Zahavi conjecture.” 13
It must therefore be inferred that the tenfold increase in travel distance was enabled by a roughly equivalent increase in travel speed. For a person who travels one hour a day, the number of kilometers travelled is therefore ten times higher than 200 years ago, which has a strong impact on their choices in terms of housing, activities, holidays, etc. The speed of transport available to people is a major reason behind the increasing the number of kilometers travelled.
Studying the average travel speed from 1960 to 2017 reveals the different factors of its evolution over time.
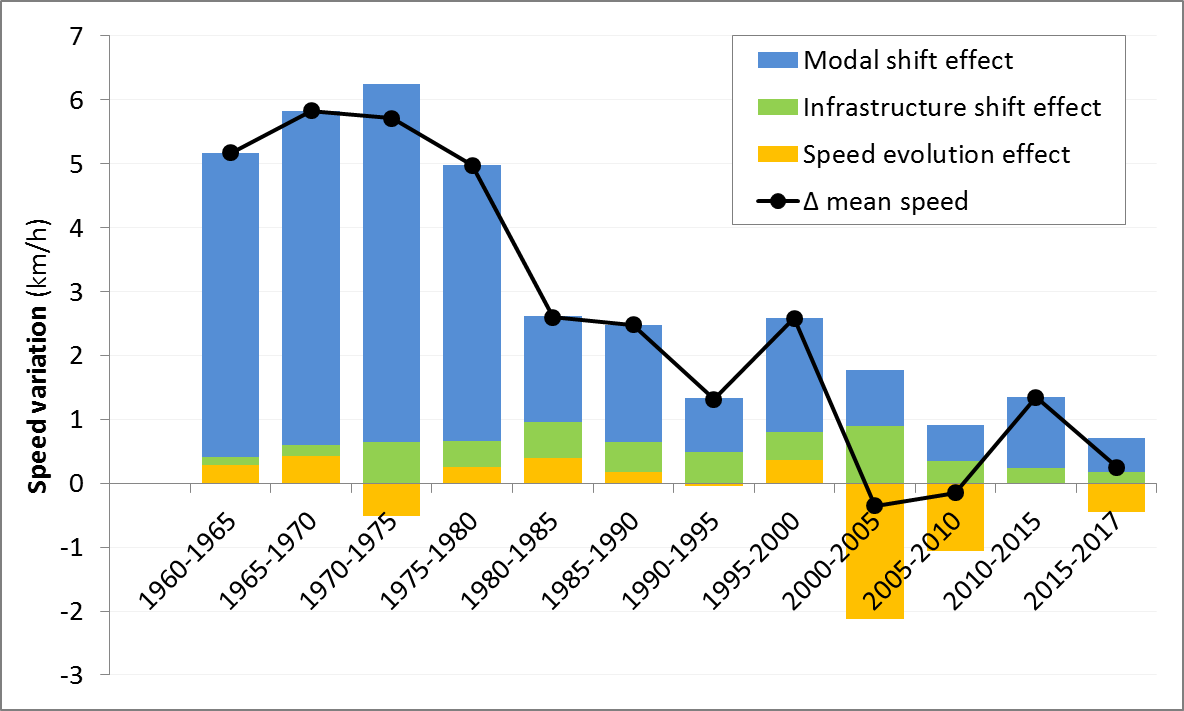
Evolution and determinants of average travel speed over time by 5-year periods (except for 2015-2017)
The spread of fast modes had a major impact, particularly in the 1960s and 1970s. Over those two decades, an increase in the average speed of about 1 km/h each year was mainly due to a modal shift from walking to cars (in blue on the graph above) 14. While cars have accounted for 62% of travel time since the early 1990s, the development of motorways (in green on the graph) contributed to the increase in its average speed. However, the increase in average travel speed was halted in the early 2000s by the introduction of speed cameras, which reduced speeds by 7 km/h on roads limited to 90 km/h or more between 2002 and 2005 15 (in yellow). This change was enough to reduce the average speed of all trips by almost 4%, and this decrease was concurrent with the decrease in the number of kilometers travelled mentioned above. In addition to the usual explanations found in the literature on the impact of oil prices or the saturation of household car ownership 16, a complementary explanation for the peak in individual demand in the 2000s would therefore come from the peak in travel speeds. This peak encouraged users to reduce the number of kilometers travelled in order to preserve their travel time.
Although speed increased slightly in the decade following 2010 along with the number of kilometers travelled (see figure at the bottom of the article), the stagnation in average speed at the turn of the millennium could call into question some of the prospective scenarios’ assumptions, particularly those of the National Low Carbon Strategy: if the speed of each short- and long-distance mode remains stable, the shift towards active modes (i.e. slower modes) predicted in the scenario would result in a slight decrease in average travel speeds; the 13% increase in kilometers travelled per person over this period could only be achieved by an increase in individual travel time of approximately 10 minutes per person per day. Even though transport times have probably increased in recent decades, such a sharp increase in just thirty years seems unrealistic. Even if it were to happen, such a scenario does not seem desirable. 17
While predicting the future is not easy, it’s fair to say that the potential margins for large increases in average speed are relatively limited 18. Furthermore, many measures for energy transition could even encourage a decrease in average speeds, and in return a decrease in travel distances per person.
Regarding the effect of modal shifts, the resurgence of walking and especially cycling observed in cities could spread throughout the whole country in the coming years, which would contribute to the slowdown. The development of cycling infrastructures 19 and pedestrian zones 20 tend to be going in this direction. While the projected growth of air travel contributes to the increase in kilometers travelled (particularly for international travel, which is excluded from the analysis), its strong climate impact would require curbing its growth in the future.
Regarding rapid transport infrastructures, which contribute greatly to increasing both speed and trips, there are currently fewer new projects being developed, particularly for budgetary reasons. This trend should continue in order to coherently pursue climate goals.
On the roads, in the context of significant delays in improving energy efficiency, one of the most effective measures in the short term would be to reduce the speed limit on motorways: by reducing this from 130 to 110 km/h, consumption per kilometer would drop by approx. 17% for internal combustion vehicles and 24% for electric vehicles. Such a measure would affect wealthier households for essential journeys, potentially making it more socially acceptable than switching to 80 km/h. Moreover, this reduction would incentivize taking the train for long-distance journeys. Finally, for several years, cities have been implementing zones with a 30 km/h speed limit, slowing down motorized traffic in favor of alternative modes.
What implicitly emerges from analyzing the National Low Carbon Strategy and current public policies is how difficult it is to conceptualize and implement restraint (by lowering demand, reducing vehicles, developing active modes, decreasing speeds, etc.) in mobility and ecological transition policies. This is a trend that is reflected in government policies as well as in the mindset of many communities, businesses and even citizens.
And yet, the race for growth is openly criticized in society today and the need for self-restraint or necessary lifestyle changes is increasingly recognized, as documented by numerous surveys: for example, in 2015, 83% of French people reported that their lifestyles would need to change significantly in order to cope with climate change, with only 16% believing that technology could solve the problem 21.
While technological developments are essential, they are insufficient on their own and must be geared towards energy and material restraint to avoid creating new environmental problems.
Historically, the acceleration of our mobility has been synonymous with increased demand and increased emissions. To achieve carbon neutrality in only 30 years, perhaps it would be reasonable, even urgent, to just... slow down?
There are already widely shared aspirations to slow down or to live in closer proximity 22. They must now be supported in order to become a reality. The collective challenge is now to imagine and implement a transition that is at once fair, coherent and exciting, moving towards more restrained lifestyles that are more resilient to future changes.
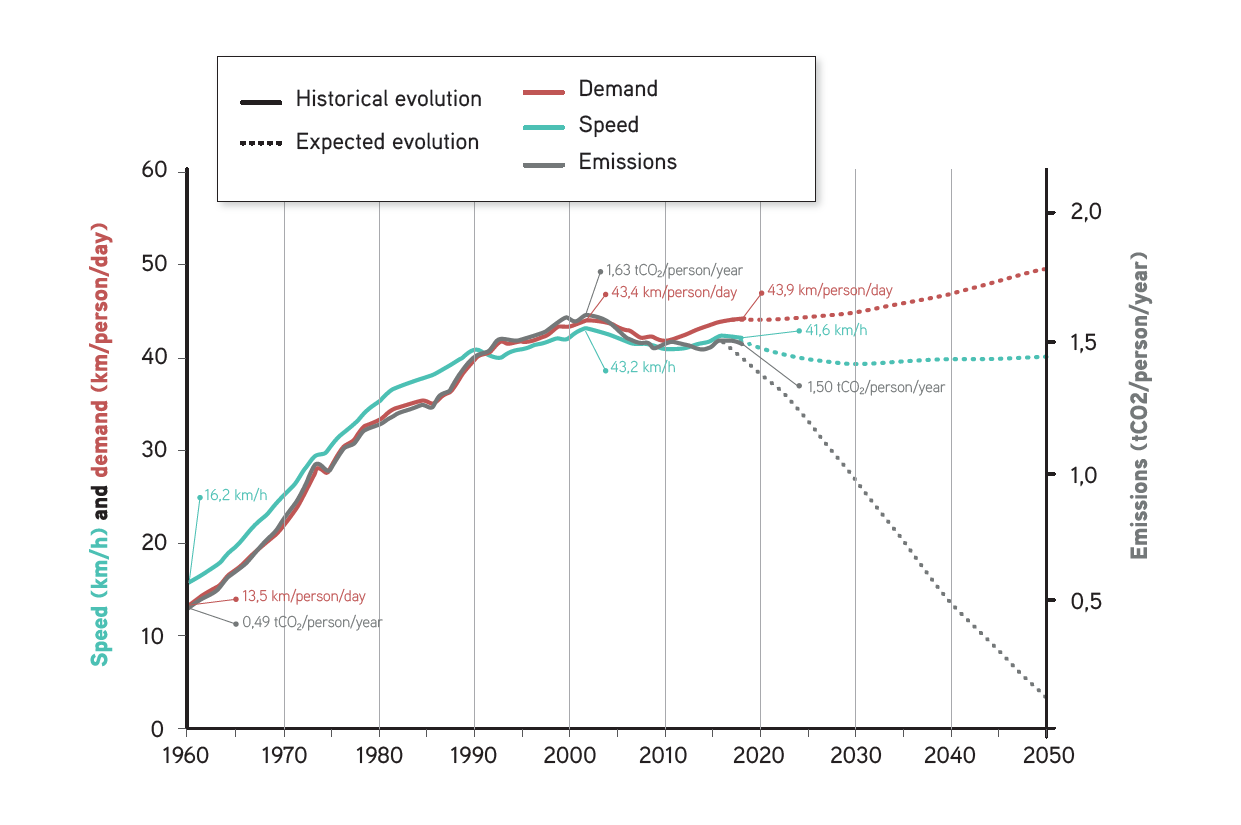
Historical evolution and expected evolution in the SNBC of individual speed, demand and emissions (including CO2 from biomass combustion), 1960-2050
For more information on the work on which this article is based:
Bigo, Aurélien, 2020. "How to decarbonize transport by 2050?", Thesis workPhD Thesis (in French). http://www.chair-energy-prosperity.org/publications/travail-de-these-decarboner-transports-dici-2050/
Bigo, Aurélien, 2020. How to explain the past trends in transport CO2 emissions in France (1960-2017)? http://www.chair-energy-prosperity.org/en/publications-2/expliquer-tendances-passees-1960-2017-emissions-de-co2-transports-france/
Bigo, Aurélien, 2020. Quantifying the potentials of transport CO2 emissions reductions through prospective scenarios analysis http://www.chair-energy-prosperity.org/en/publications-2/quantifying-the-potentials-of-transport-co2-emissions-reductions-through-prospective-scenarios-analysis/
References cited in the article:
ADEME, 2013. “The environmental impacts of electric and internal combustion vehicles” https://presse.ademe.fr/2013/12/les-impacts-sur-lenvironnement-des-vehicules-electriques-et-thermiques.html
ADEME, 2018. “Life cycle assessment.” https://www.ademe.fr/expertises/consommer-autrement/passer-a-laction/dossier/lanalyse-cycle-vie/quest-lacv
Crozet, Yves, Mobile Lives Forum, 2019. "Travel speed." https://fr.forumviesmobiles.org/reperes/vitesse-des-deplacements-12976
Mobile Lives Forum and ObSoCo, 2016. "Aspirations for mobility and lifestyles - international survey." http://fr.forumviesmobiles.org/projet/2016/05/23/aspirations-liees-mobilite-et-aux-modes-vie-enquete-internationale-3240
Grimal, Richard, Mobile Lives Forum, 2017. “Car traffic reaches a peak: and now, the beginning of decline?" https://fr.forumviesmobiles.org/mobilithese/2017/09/28/plafonnement-circulation-automobile-premisses-dun-declin-3694
MTES, 2020. "National Low Carbon Strategy Project." https://www.ecologique-solidaire.gouv.fr/strategie-nationale-bas-carbone-snbc
ONISR. "Speed Observatory." https://www.onisr.securite-routiere.interieur.gouv.fr/contenus/etudes-et-recherches/comportements-en-circulation/observations/observatoire-des-vitesses
Pew Research Center, 2015. "Global Concern about Climate Change, Broad Support for Limiting Emissions." https://www.pewresearch.org/global/2015/11/05/global-concern-about-climate-change-broad-support-for-limiting-emissions/
1 MTES, 2020. “National Low Carbon Strategy Project.” https://www.ecologique-solidaire.gouv.fr/strategie-nationale-bas-carbone-snbc
2 https://www.ecologique-solidaire.gouv.fr/sites/default/files/2020-03-25_MTES_SNBC2.pdf (consulted in May 2020). These five levers also apply to the transport of goods, with slightly different units (tonnes.km, load in tons/veh...), but here we are only looking at the mobility of people. The kilometers travelled by freight drivers aren’t included; only those that correspond to passenger transport, estimated at 60% of LCVs (light commercial vehicles), are taken into account.
3 The focus of the article is domestic passenger transport. It excludes international air traffic due to unavailable data regarding international travel for certain prospective scenarios, and in order to keep a constant scope throughout the three analyses (past, scenarios and speed). Including international travel, emissions have been roughly constant since the early 2000s. They have increased by a factor of 4.7 since 1960 and demand has increased by a factor of 5.3. Only direct emissions (related to burning oil) are accounted for.
4 France Strategy, 2019. “How to finally reduce CO2 emissions from cars,” https://www.strategie.gouv.fr/publications/faire-enfin-baisser-emissions-de-co2-voitures (consulted in May 2020).
6 Bigo, Aurélien, 2020. “How can we explain past trends (1960-2017) of CO2 emissions in transport in France?” http://www.chair-energy-prosperity.org/publications/expliquer-tendances-passees-1960-2017-emissions-de-co2-transports-france/
7 For each lever, the calculated coefficient corresponds to the evolution of emissions following the activation of that lever alone: for example, the demand coefficient of 1.26 implies that emissions will increase by 26% if demand is the only lever to be changed by 2050. In calculating the coefficients of the decomposition analysis, each of the five levers is considered independent of the others. However, in reality there are of course interactions between these levers: for example, decarbonization (carbon intensity) will be all the more easy to achieve when total energy consumption (which results from changes in the other four factors) is low; similarly, modal shift is easier if demand is low; just as the electrification of vehicles simultaneously affects energy efficiency and carbon intensity. This calls for simultaneous action on the 5 levers to avoid rebound effects.
8 Electric cars enjoy better efficiency in final energy (energy used, after conversion into electricity in this case). In the decomposition analysis, the transition to electric cars therefore leads to gains in the efficiency and carbon intensity of energy. Measured in life cycle assessment in primary energy, these strong gains in energy efficiency are no longer valid: ADEME, 2013, “The environmental impacts of electric and internal combustion vehicles” https://presse.ademe.fr/2013/12/les-impacts-sur-lenvironnement-des-vehicules-electriques-et-thermiques.html (consulted in May 2020).
9 In addition to the Ministry’s scenarios, the scenarios produced by the following institutions were studied: Entreprises pour l’environnement (EpE), the French Environment and Energy Management Agency (ADEME), the NégaWatt association, the International Energy Agency (IEA), the Institute for Sustainable Development and International Relations (IDDRI) and the SNCF.
10 To learn more about the decomposition analysis of these scenarios, see: Bigo, Aurélien, 2020. “Quantifying the potentials of transport CO2 emissions reductions through the decomposition analysis of prospective scenarios. Working Paper ». http://www.chair-energy-prosperity.org/publications/travail-de-these-decarboner-transports-dici-2050/
11 -21% for the ADEME’s scenario, -10% for the IEA’s EV30 scenario, -5% for the IDDRI’s MOB-first scenario, and +1% for the SNCF’s Proximobility scenario.
12 For example: metal consumption and ecotoxicity for the manufacture of electric vehicle batteries, biomass resources (for biofuels or biogas) in limited quantities to avoid deforestation or competition with food uses.
13 On this subject, see Crozet, Yves, Mobile Lives Forum, 2019. “Travel speed.” https://fr.forumviesmobiles.org/reperes/vitesse-des-deplacements-12976
14 The spread of fast modes (cars, trains, planes...) is calculated as a structural effect between the shares of the different modes of travel. Modal shares are calculated in terms of travel time and not in kilometers travelled, hence the strong importance of walking.
15 ONISR. “Speed Observatory.” https://www.onisr.securite-routiere.interieur.gouv.fr/contenus/etudes-et-recherches/comportements-en-circulation/observations/observatoire-des-vitesses
16 Grimal, Richard, Mobile Lives Forum, 2017. “Car traffic reaches a peak: and now, the beginning of decline?" https://fr.forumviesmobiles.org/mobilithese/2017/09/28/plafonnement-circulation-automobile-premisses-dun-declin-3694
17 See the results of the survey: Mobile Lives Forum and ObSoCo, 2016. “Aspirations for mobility and lifestyles - international survey.” http://fr.forumviesmobiles.org/projet/2016/05/23/aspirations-liees-mobilite-et-aux-modes-vie-enquete-internationale-3240
18 See Crozet, Yves, Mobile Lives Forum, 2019. “Travel speed.” https://fr.forumviesmobiles.org/reperes/vitesse-des-deplacements-12976
19 See https://fr.forumviesmobiles.org/reperes/systeme-velo-12437
20 See https://fr.forumviesmobiles.org/projet/2019/01/17/centre-ville-pietonnisation-
et-modes-vie-1283221 Pew Research Center, 2015. “Global Concern about Climate Change, Broad Support for Limiting Emissions.” https://www.pewresearch.org/global/2015/11/05/global-concern-about-climate-change-broad-support-for-limiting-emissions/
22 Mobile Lives Forum and ObSoCo, 2016. “Aspirations for mobility and lifestyles - international survey.” http://fr.forumviesmobiles.org/projet/2016/05/23/aspirations-liees-mobilite-et-aux-modes-vie-enquete-internationale-3240
For the Mobile Lives Forum, mobility is understood as the process of how individuals travel across distances in order to deploy through time and space the activities that make up their lifestyles. These travel practices are embedded in socio-technical systems, produced by transport and communication industries and techniques, and by normative discourses on these practices, with considerable social, environmental and spatial impacts.
En savoir plus xSpeed of travel is the relationship between the traveled distance and the time it takes for an individual to travel it.
En savoir plus xA lifestyle is a composition of daily activities and experiences that give sense and meaning to the life of a person or a group in time and space.
En savoir plus xTo cite this publication :
Aurélien Bigo (18 June 2020), « France’s National Low-Carbon Strategy: Can it work without slowing down? », Préparer la transition mobilitaire. Consulté le 09 January 2025, URL: https://forumviesmobiles.org./en/new-voices/13345/frances-national-low-carbon-strategy-can-it-work-without-slowing-down